Latest Data from All Stations
You can also see these figures with the data sorted by station id.
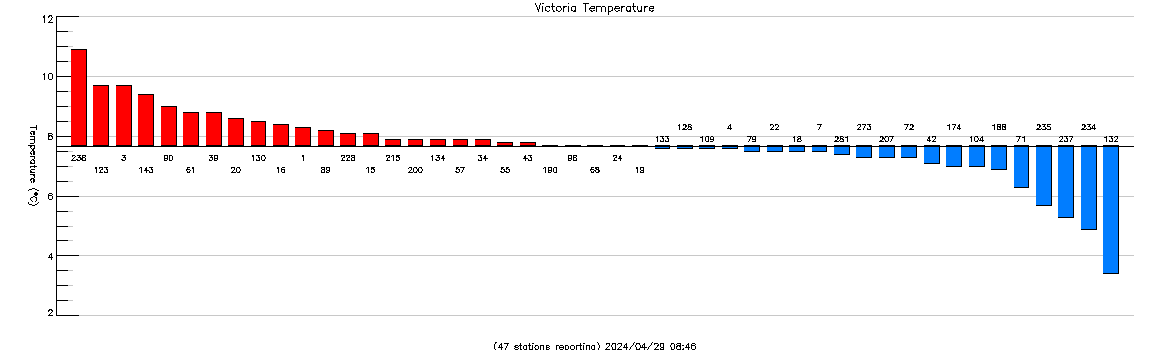
This figure shows the current temperature at each station in our network. The horizontal line corresponds to the mean value across the network. The red bars show stations that are warmer than the network average while the blue bars show stations that are colder than the network average. The top of each red bar or bottom of each blue bar indicates the observed temperature at that station. Station numbers are shown below the red bars, above the blue bars and next to the station names in the table.
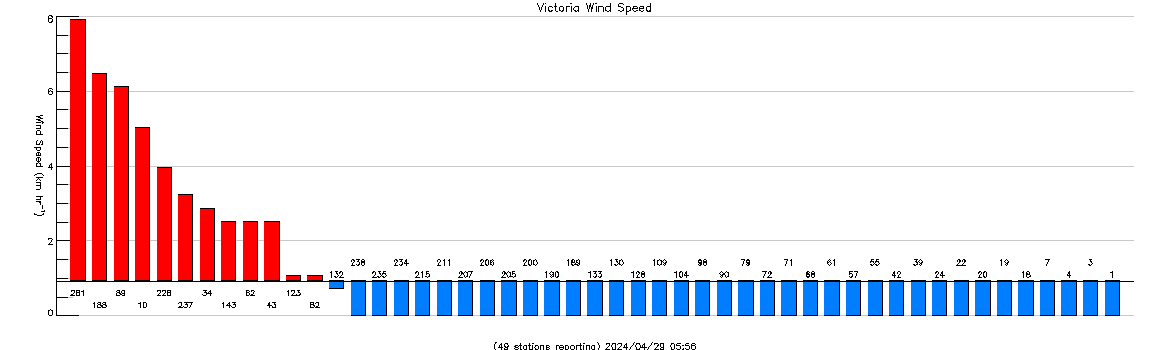
This figure shows the current windspeed at each station in our network.
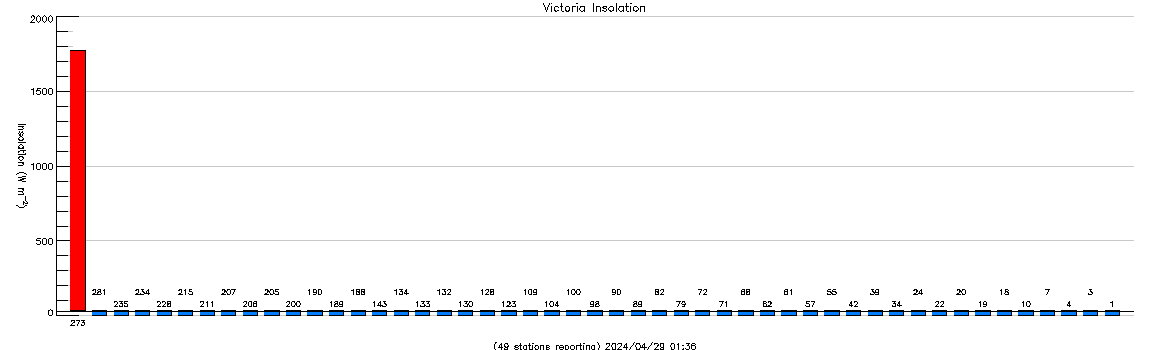
This figure shows the current insolation (intensity of visible light) at each station in our network.
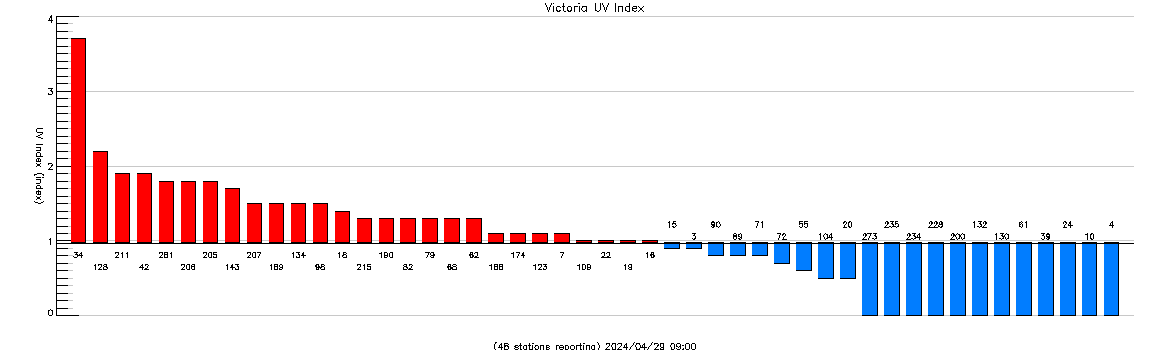
This figure shows the current UV Index at each station in our network.
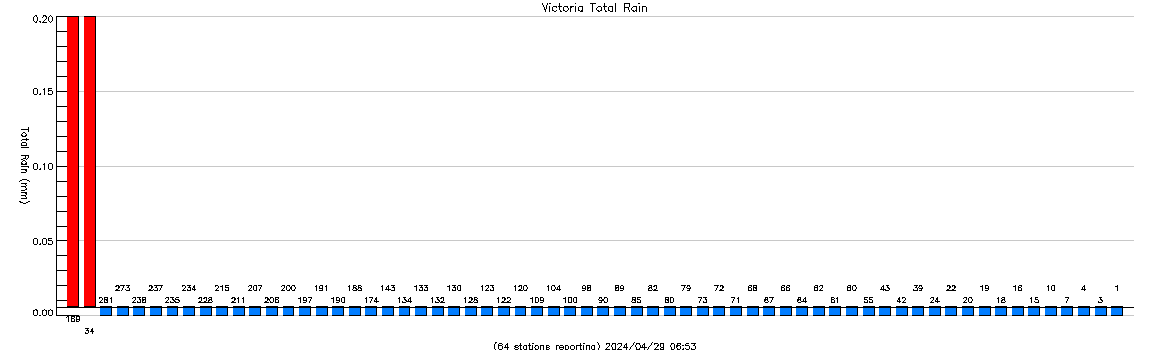
This figure shows the current daily total rain at each station in our network.
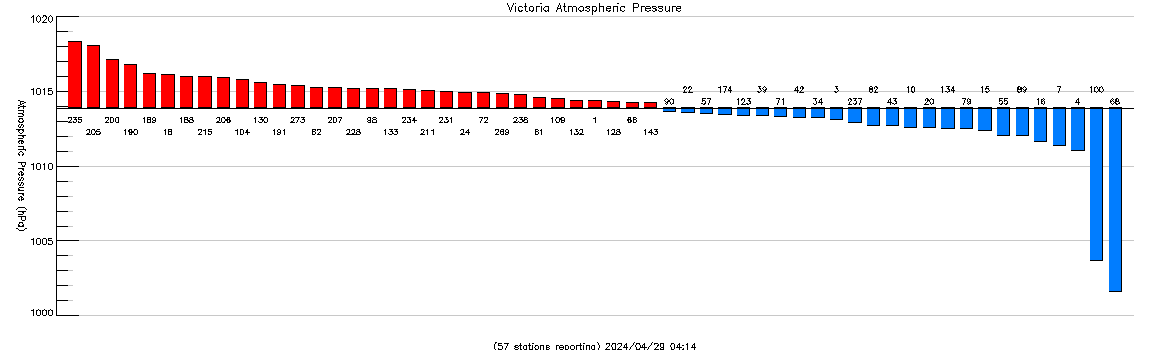
This figure shows the current pressure at each station in our network.
| Number | Station Name | Error 1055 : Expression #1 of SELECT list is not in GROUP BY clause and contains nonaggregated column 'meteo.sdata.timekey' which is not functionally dependent on columns in GROUP BY clause; this is incompatible with sql_mode=only_full_group_by
|---|